Evolving Perceptions of Immigration: Evidence from Two Rounds of New Jersey Polling
JUNE 2026
Authors: Ramya Vijaya, Alicja Schleyer
1. Introduction

Ramya Vijaya (lead author)
Professor of Economics at Stockton University and a Hughes Center Faculty Research Fellow for 2025-2026
Attitudes toward immigration have periodically emerged as a politically charged and polarizing issue in the United States and in Europe over the past few decades. Despite accumulated literature on the overall positive economic impact of immigration in the U.S., negative perceptions of immigration and immigrants intensified around 2021 and became particularly prominent during the 2024 election cycle. A nascent reversal of the trend began to emerge in 2025. As more restrictive immigration enforcement measures were implemented and received widespread attention, public support for immigrants and immigration seemed to see a resurgence. This rapid shift in public opinion within a relatively short period of time provided a useful window for evaluating the factors that contribute to changing attitudes toward immigration.
This study draws on two rounds of state-representative polling, data, conducted in collaboration with Stockton University’s Hughes Center for Public Policy in New Jersey in 2024 and 2026, to gain a better understanding of public perceptions about immigration. Since both polling cycles drew samples from the same population base of New Jersey registered voters within a short span of time, the data offered us a good opportunity to compare the patterns and factors that influenced the shifts. Consistent with previous research, we found that attitudes toward immigration differed by age and racial identity. At the same time our findings also suggested that racial divisiveness might be transitory, tracking negative news headlines and the media cycles. Age and racial differences in attitudes were most persistent only in the 2024 polling data when the overall national sentiment toward immigrants had turned negative following a period of inflammatory anti-immigrant political rhetoric that was often amplified in the media. However, as the more aggressive anti-immigration efforts in 2025 drew backlash and positive sentiments toward immigration reemerged, the racial divisions on immigration receded. A majority across all racial groups were more supportive of immigrants and immigration in the 2026 poll.
Even with the resurgence of overall positive attitudes toward immigration, in our 2026 poll we found that those with less formal education continued to show reservations. Past literature has identified two broad mechanisms through which immigration tends to become politically polarizing despite existing research on economic benefits. One is through a cultural backlash or identity-related fears and processes and the other through economic insecurity. While racial and cultural identity fears did emerge in 2024, they also faded quickly as larger media narratives shifted in 2025. Those in lower education groups, on the other hand, were slower to let go of their opposition to immigration, indicating perhaps the deeper influence of economic insecurities.
We also found that the presence of immigrant communities made a difference in perceptions. Perceptions about immigration were far more positive in New Jersey counties that have a large concentration of immigrants in both polling cycles. Similarly, these counties also saw the lowest amount of support for more restrictive immigration policies and enforcement measures like mass deportation. This suggests support for the theory that the frequency of interaction with immigrants tends to reduce the unsubstantiated fears and biases that people might carry about immigration.
2. The literature on public perception of immigration
Politically contentious discourse around immigration trends has a long history globally and in the United States. In more recent times inflamed rhetoric around immigration has seen a rising arc since the 2015 refugee crisis when the surge of Syrian refugees had a considerable impact on the political discourse in Europe and later in the United States. Several studies have evaluated the impact of the inflamed rhetoric and media coverage of migrants and refugees around this period on polarization as well as the spread of nationalist and authoritarian populist movements.[1] Scholars have also described a growing discrepancy between the perceptions about immigrants and the reality of the economic impact of immigration on developed economies in Europe and the United States.[2] Misperceptions about immigration often rely on an overestimation of the scale of immigration. Additionally, despite evidence in the economic literature, there remains concerns about immigrants worsening employment opportunities and wage outlook for native-born workers.
These concerns are contrary to the consensus in the economic literature which finds either no impact or in many cases positive impact of immigration on the outcomes for native-born workers.[3] The positive impact is primarily attributed to the fact that immigrant labor tends to completement rather than compete with native-born workers. Jobs performed by immigrants expand the availability of employment opportunities for native-born workers and contribute to their upskilling. Economic fears also create an additional misperception that immigrants represent a fiscal burden due to their perceived over-reliance on the welfare system. There is once again no substantial evidence for this. In fact, immigrants tend to create a fiscal gain rather than a drain, since they often contribute more to federal taxes than they receive in federal benefits.[4] Beyond economic fears, attitudes toward immigration are also said to be influenced by other cultural or identity-related processes where immigrants are seen as the outgroup that threatens the way of life and social norms of the ingroup.[5]
There is some debate over which of these two threads tend to be the more dominant driver of perceptions about immigration– economic insecurities or the cultural and identity-related fears. There are some historical studies about the connection between economic insecurities and attitudes toward immigration. For example, Tabellini (2020) considered the anti-immigrant sentiments in the United States from 1910-1930 which led to the restrictive Immigration Acts of the1920s.[6] They found that immigration during this period did not negatively impact native-born workers and in fact it increased employment and allowed occupational upgrading. They conclude that it was not economic insecurity but rather cultural insecurities about differences between immigrants and natives at the time that drove the negative sentiments. In more recent decades, Dustman and Preston (2000) examined a similar question about anti-immigrant sentiments in Britain.[7] Though they did find that labor market concerns did influence attitudes toward immigration, they found that racially motivated opposition to immigration was more dominant.
Other more recent studies approach this difference between cultural versus economic drivers indirectly. For example, a few different studies find that support for redistribution policies decreases when there is increased immigration, particularly when immigration has increased the ethnic diversity of a community, once again indicating cultural and identity-related processes.[8] However, Rodrik (2022) suggested that there has not been a sufficient investigation of the two trends – economic insecurity versus cultural fear, separately.[9] There are also no recent studies that provide a more updated look at these different mechanisms that influence attitudes toward immigration.
The trends in the United States from 2021-2026 when attitudes toward immigration underwent significant and contrasting changes, whiplashing from extremely negative to a resurgent positive trend, provides a unique window to evaluate cultural versus economic drivers of attitudes toward immigration. Generally, national polls indicated a change in attitudes toward immigration in 2025 after negative perceptions peaked from around 2021-2024, particularly in the run-up to the 2024 presidential election. Beginning in 2025, the new federal administration’s efforts to limit immigration began to take shape, with suspension of the U.S. refugee resettlement program and asylum processing, expanding the list of countries with travel bans, and engaging in more aggressive deportation and Immigration and Customs Enforcement (ICE) tactics. Seemingly in reaction to this, particularly the expanded ICE activity, the negative perceptions began to recede, and more positive views saw a resurgence.
For example, Gallup polling showed that in 2025, 30 percent of Americans wanted immigration to be reduced– a dramatic drop from 55 percent of Americans in 2024. National polls from Gallup, Pew Research, and the New York Times also suggest that more sizable majorities now disapprove of the more extreme anti-immigration efforts of the Trump administration. For instance, Pew Research found that, as of June 2025, only 37 percent of Americans approved of the Trump administration’s controversial choice to deport some illegal immigrants to a prison in El Salvador. This poll also found that only 39 percent of Americans approved of suspending most asylum applications. On the other hand, the number of people who think immigration and immigrants are overall a benefit to the economy and the country also increased. Gallup polling found that in 2025, an unprecedented 79 percent of U.S. adults thought that immigration is good for the country.
This dip and then resurgence of support for immigration provides a useful window for examining the various factors that influence attitudes toward immigration. For instance, were the negative trends from 2021-2024 due to rising economic insecurities or did it represent an ascendence of cultural and racial identity-based fears? Was the resurgence of positive views uniform across all demographic and income groupings of respondents? Or were there some lingering patterns of economic anxiety that remained beneath the surface of a seeming recovery of positive attitudes toward immigration? To explore these questions, we were able to conduct two timely opinion polls among registered voters in the state of New Jersey during the two phases of this cycle – one in 2024 when the negative cycle peaked and another in 2026 when the positive cycle reemerged.
Data from New Jersey provided a useful case study to study these issues since the state has a relatively high dependence on immigrant labor. Foreign-born workers account for 30 percent of the total New Jersey labor force compared to 19 percent at the national level. A little over 35 percent of entrepreneurs in New Jersey are also foreign-born.[10] At the same time there is also considerable county-level variation in the state. In some northern counties, immigrant labor constitutes close to 50 percent of the total labor force, whereas there are other more southern counties where immigrants make up closer to only 10 percent of the labor force. There is also considerable variation in per capita income across counties in the state. In the following section we provide more details on the data and our analysis.
3. Tracking two rounds of New Jersey polling data on immigration
For each round of polling, survey data was collected through a multimodal approach using a random sample of registered voters drawn from the New Jersey registration file. A range of 600-700 voters were interviewed for each poll. Respondents were contacted by telephone by a live interviewer or received a text message containing a single-use link to take the survey online. Both cell phone and landline numbers were included within the single sampling frame. Data were weighted using iterative proportional fitting, or raking, based on demographic benchmarks for New Jersey’s voting eligible population from the U.S. Census Bureau’s 2023 American Community Survey to ensure the sample more accurately reflected the statewide voting population. Weighting variables included age, ethnicity, education level, region, and sex.
In the 2024 poll results, a majority of 55 percent viewed immigration as an overall good thing. This is not surprising given that attitudes toward immigration tend to be more positive in this state compared to the national average. However, the poll also showed that perceptions in New Jersey were shifting as the national mood had turned against immigration. A majority of 51 percent indicated that immigration to the U.S. should be more difficult. This was a departure when compared to a past poll question from 2022, when only 35 percent of respondents had indicated that immigration should be more difficult. We then delved a bit deeper to explore where such negative perceptions might be coming from.
As discussed above, the two big themes explored in previous literature are whether the negative perceptions stem from economic insecurities or from cultural issues. As Rodrik (2022) discusses, the influence of economic insecurity is often felt when immigrants are perceived as being low-skilled and in direct labor competition with local low-skilled labor.[11] In this case we would expect to see differences in attitudes based on the income categories that respondents belong to. We might also expect to see different attitudes between richer versus poorer counties in the state. Beyond this there are also a few other demographic variables that have been found to influence attitudes. For example, differences across age groups are common. National polls have found that older age groups tend to be more wary of immigration and immigrants (Pew Research). Similarly race appears to play a significant role in perceptions of immigration. The greatest support for more restrictive immigration policies comes from those who identify as White.
Several studies also discuss the contact hypothesis, where repeated interaction with immigrants, usually in immigrant-dense areas, tends to reduce the prevalence of negative stereotypes and improves perceptions about immigration.[12] In our case, based on the contact hypothesis we would expect to find a difference in perceptions between immigrant-dense counties in the state versus counties with a lower concentration of immigrants. To investigate some of these demographic and county-level factors, we combined polling data with county level aggregates from the 2023 ACS. For each county we used ACS data to calculate the percentage of the labor force that was foreign-born. We used this to assess the density of immigrant labor for each county. We also gathered the unemployment rate and per capita income for each county.
Results of the October 2024 Poll
Prominent Demographic Differences in Immigration Attitudes
The most prominent findings from the 2024 poll were that attitudes toward immigration differed significantly across demographic groups, particularly by age and race. While statistically significant differences appeared across most survey questions, this section focuses on the strongest divides which emerged when comparing whether demographic groups expressed clear majority support for immigration or support for more restrictive immigration policies.
Age – The poll found a strong generational divide in perceptions of immigration. Younger respondents were consistently more supportive of immigration and less supportive of restrictive immigration policies than older respondents.
For instance, in Table 1 we see that large majorities of adults age 18-29 (73%) and 30-44 (64%) said immigration is generally a good thing for the country. Among older respondents, however, opinions were much more divided. Only half of respondents ages 45-64 viewed immigration positively, while fewer than half of respondents ages 65 and older (48%) described immigration as a good thing.
|
Age* |
||||
|
|
18-29 |
30-44 |
45-64 |
65 and Older |
|
Good Thing |
73% |
64% |
50% |
48% |
|
Bad Thing |
14% |
26% |
39% |
43% |
|
Not Sure |
13% |
10% |
11% |
9% |
** Statistically Significant at the 99 percent confidence level Chi-Square = 25.8, p = 0.02
Data Source: Stockton Poll of NJ voters, n=616, Oct. 2024
The generational divide became even more pronounced when respondents were asked whether immigration to the U.S. should be more difficult. As shown in Table 2, majorities of older respondents favored stricter immigration policies, including 59 percent of adults ages 45-64 and 64 percent of adults ages 65 and older. Younger respondents, however, were far less likely to support increasing immigration restrictions. Among respondents ages 18-29, only 25 percent favored making immigration more difficult, while opinions were more evenly split between maintaining current policies, making immigration less difficult, or increasing restrictions. Together, these findings suggest that younger adults held substantially more favorable views toward immigration and were less supportive of restrictive immigration policies than older adults.
|
Age* |
||||
|
|
18-29 |
30-44 |
45-64 |
65 and Older |
|
Less Difficult |
34% |
27% |
16% |
13% |
|
Satisfied |
32% |
27% |
15% |
17% |
|
More Difficult |
25% |
40% |
59% |
64% |
|
Not Sure |
9% |
10% |
10% |
7% |
** Statistically Significant at the 99 percent confidence level Chi-Square = 51.8, p = 0.00
Data Source: Stockton Poll of NJ voters, n=616, Oct. 2024
Race – The poll also revealed substantial racial differences in immigration attitudes and policy preferences. As shown in Table 3, White respondents were the most likely to support making immigration more difficult, with 54 percent favoring stricter immigration policies. In contrast, fewer than half of Black respondents and respondents identifying as multiracial or some other race aside from the standard Census Bureau race categories favored stricter immigration laws (41% and 43%, respectively) and said they were satisfied with current policies at higher rates than their White counterparts.
|
Race* |
|||
|
Other/Multiracial |
Black/African American |
White |
|
|
Less Difficult |
7% |
29% |
20% |
|
Satisfied |
38% |
28% |
16% |
|
More Difficult |
43% |
41% |
54% |
|
Not Sure |
12% |
3% |
8% |
** Statistically Significant at the 99 percent confidence level Chi-Square = 33.5, p = 0.00
Data for Asian/Pacific Islander respondents not shown due to insufficient sample size
Data Source: Stockton Poll of NJ voters, n=616, Oct. 2024
Differences also emerged regarding deportation efforts. In Table 4, White respondents were the only racial group in which a majority supported a national effort to deport people living in the country illegally. Combining the responses of “strongly support” and “somewhat support,” 60 percent of White respondents supported national deportation efforts. No other racial group expressed as strong support for mass deportation efforts.
|
Race* |
|||
|
|
Other/Multiracial |
Black/African American |
White |
|
Strongly Support |
32% |
27% |
38% |
|
Somewhat Support |
19% |
22% |
22% |
|
Somewhat Oppose |
12% |
20% |
19% |
|
Strongly Oppose |
33% |
18% |
17% |
|
Not Sure |
3% |
13% |
3% |
* Statistically Significant at the 95 percent confidence level Chi-Square = 30.2, p = 0.05
Data for Asian/Pacific Islander respondents not shown due to insufficient sample size
Data Source: Stockton Poll of NJ voters, n=616, Oct. 2024
Finally, Table 5 shows that although majorities of all racial groups said that immigration is generally a good thing for this country, the intensity of that support varied substantially. A slim majority of those who identify as White (52%) responded that immigration was a good thing overall, a lower rate than other racial groups.
|
Race* |
|||
|
Other/Multiracial |
Black/African American |
White |
|
|
Good Thing |
58% |
64% |
52% |
|
Bad Thing |
28% |
23% |
36% |
|
Not Sure |
8% |
13% |
10% |
* Statistically Significant at the 90 percent confidence level Chi-Square = 13.7, p = 0.01
Data for Asian/Pacific Islander respondents not shown due to insufficient sample size
Data Source: Stockton Poll of NJ voters, n=616, Oct. 2024
Taken together, the findings suggest that White respondents consistently expressed greater skepticism toward immigration and stronger support for restrictive immigration policies than other racial groups during the 2024 polling cycle.
Greater Contact with Immigrants Mitigates Negative Perceptions
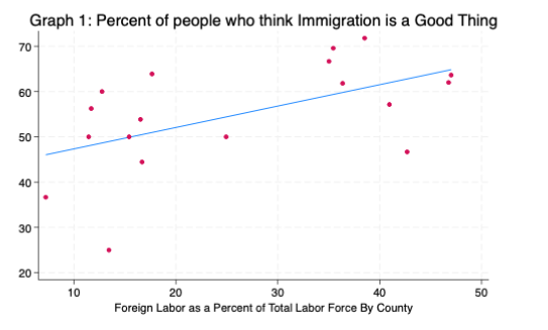
In the 2024 poll we also found consistent support for the contact hypothesis, which suggests that repeated interaction with immigrants tends to reduce negative stereotypes and improve perceptions of immigration. Immigrant-dense counties, where the potential for repeated contact with immigrants is higher, saw more support for immigrants and less support for restrictive immigration policies. Graph 1 shows a positive correlation between the proportion of foreign workers in a county and the proportion of respondents who said immigration is a good thing for the country. In counties with higher proportions of foreign-born workers, there tended to be a higher percentage of people indicating that immigration was a good thing overall. Similarly, Graph 2 shows that support for a national deportation effort declined considerably in counties with higher proportions of foreign labor. These findings suggest that greater opportunities for direct interaction with immigrants may reduce negative stereotypes and fears surrounding immigration.
Graph 1
To investigate this pattern further, Table 6 compares responses among White respondents living in counties with low, medium, and high immigrant labor density. Immigrant labor density in New Jersey counties ranges from a low of approximately 11 percent of the labor force in Ocean County to a high of nearly 47 percent of the labor force in Middlesex County. Based on this range, counties were categorized from low immigrant labor density (<15% of the labor force is foreign-born), medium (15-35% of the labor force is foreign-born), and high immigrant labor density counties (>35% of the labor force is foreign-born). The findings show (Tabe 6) that support for immigration among White respondents increased substantially as immigrant labor density increased. Among White respondents living in counties with a high immigrant labor density, 61 percent said immigration was a good thing for the country. In counties with low immigrant labor density, that figure was 42 percent among White respondents, while nearly half viewed immigration negatively. These findings suggest that while the most consistent hesitation about immigration was from those who identified as White, as per the earlier tables, greater exposure to immigrant communities may temper this skepticism toward immigration, consistent with the contact hypothesis.
|
White Respondents only* |
|||
|
High Immigrant Labor Density |
Medium Immigrant Labor Density |
Low Immigrant Labor Density |
|
|
Good Thing |
61% |
48% |
42% |
|
Bad Thing |
31% |
38% |
48% |
|
Not Sure |
8% |
14% |
9% |
* Statistically Significant at the 90 percent confidence level Chi-Square = 13.7, p = 0.01
Data Source: Stockton Poll of NJ voters, n=616, Oct. 2024
Economic Insecurity Took a Back Seat to Divisive Racial Identity-Related Fears
It is also important to note some of the patterns that we did not find in the 2024 poll. There were no statistically significant gender differences in the results. We also did not find any significant differences by household income. Individuals were asked to identify their household income band as part of the survey. Using this information, we found no significant differences between responses of those in higher versus lower income bands. We further looked to see whether differences varied across richer or poorer counties. For this analysis, we used per capita income and unemployment rates for each county. There is a positive correlation between per capita income and immigrant-density in New Jersey. That is, we see the higher immigrant-dense counties tend to have higher per capita income. However, there were no identifiable differences in immigration attitudes across counties based on per capita income or unemployment rate.
The lack of significant differences along income lines seemed to suggest that economic insecurities were not the primary drivers of the negative trend in attitudes that seemed to be prevalent during this period. On the other hand, the racial differences suggest that it was perhaps cultural and identity-related fears that were at the forefront. The inflamed political rhetoric around migration during the 2024 election cycle in the U.S. and its extensive coverage in the news media was particularly charged against racial and religious minority groups. The widely circulated false claims about Haitian immigrants in Ohio eating pets exemplified this rhetoric.[13] Others have also pointed to the anti-immigration rhetoric touching on white nationalist fears of great replacement.[14] All of this suggests that the racial differences in the New Jersey poll responses were more likely tied to cultural and racial identity fears, as opposed to economic insecurity. While polling data alone cannot determine causation, the stronger racial and age-related differences observed in the survey are consistent with previous research suggesting that cultural and identity-related concerns can play an important role in shaping immigration attitudes.
The findings related to the contact hypothesis provide additional context for understanding these patterns. Negative attitudes toward immigration tended to be weaker in immigrant-dense counties, where residents are more likely to regularly interact with immigrant communities. This may also help explain the generational differences observed in the poll. Younger age groups may have had more opportunities for such interactions as counties in New Jersey have become more diverse and immigrant-dense over the years. As a result, they may have been less influenced by negative stereotypes or inflammatory rhetoric around immigration.
Results of the February 2026 Poll
Resurgence of Support for Immigration, Age and Racial Differences Recede
The broader political and media environment surrounding immigration shifted considerably between the 2024 and 2026 polling periods. Beginning in 2025, the federal government implemented a series of more restrictive immigration enforcement measures, including expanded deportation efforts and increased ICE activity. As a result, media coverage increasingly focused on immigration enforcement policies and their implementation. During the period when the 2026 poll was conducted, several high-profile immigration enforcement incidents in Minneapolis received widespread national attention, including encounters with ICE agents that resulted in the deaths of two U.S. citizens. At the same time, national polling showed a rebound in positive attitudes toward immigration and growing skepticism toward some enforcement measures.
The 2026 poll of New Jersey voters reflected many of these broader national trends. Overall, attitudes toward immigration became substantially more positive compared to the 2024 poll, and some of the sharp demographic divides that were especially prominent in 2024 became less pronounced. As shown in Graph 3, the share of respondents who said immigration is a good thing for the country increased across all age groups. In the 2024 poll, older respondents were significantly less likely than younger respondents to express positive views toward immigration. In 2026, however, clear majorities across every age category viewed immigration positively. Among voters 65 and older, for example, the share of those who said immigration is a good thing increased from 48 percent in 2024 to about 70 percent in 2026.
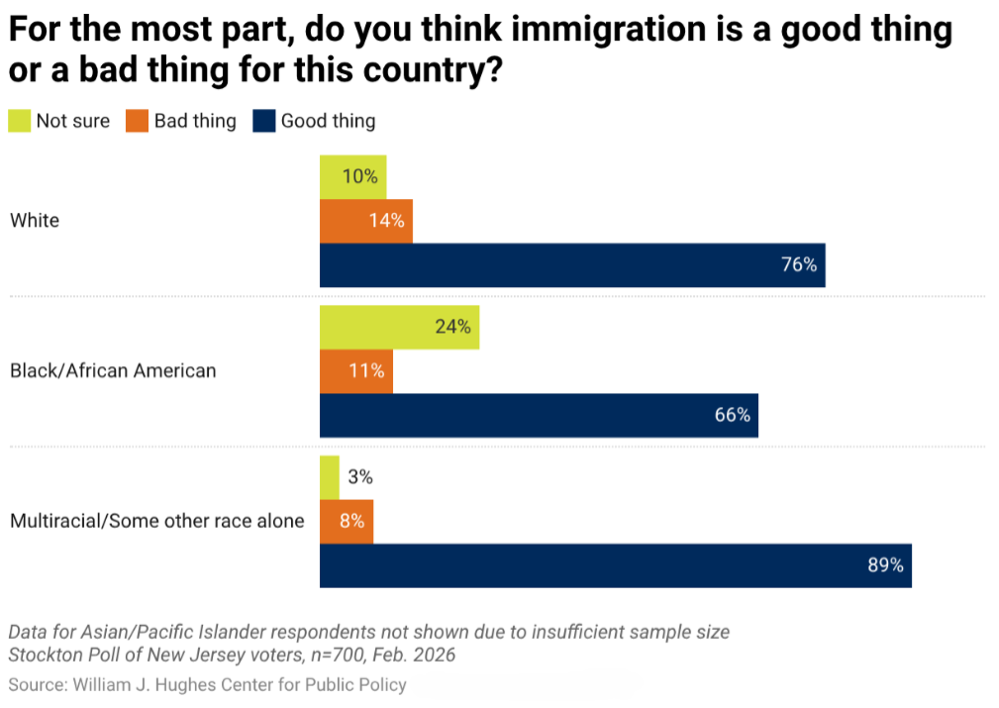
Similarly, the racial divide that was prominent in the 2024 poll also seems to be receding in 2026. A strong majority of respondents across all racial categories now see immigration as a good thing (Graph 4). In the 2024 poll, White respondents expressed substantially lower levels of support for immigration than other racial groups. By 2026, however, strong majorities across all racial categories described immigration as a good thing for the country. Among White respondents, in particular, positive views toward immigration increased from 53 percent in 2024 to 76 percent in 2026.
Graph 2
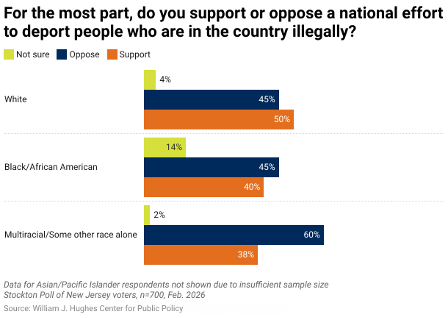
Support for mass deportation efforts also declined across all racial groups. As shown in Graph 5, no racial category demonstrated clear majority support for a national deportation effort in the 2026 poll. In the 2024 poll, 60 percent of White respondents indicated support for mass deportation. In 2026, support among White respondents fell to 50 percent, eliminating the clear majority observed in the earlier poll.
Graph 3
Taken together, these findings suggest that attitudes toward immigration became more favorable overall in 2026 and that the age and racial differences that were prominent in the 2024 poll had narrowed considerably.
A Large Gender Divide Emerges
Since age and race were no longer the primary drivers of negative attitudes toward immigration in the 2026 poll, we conducted additional analyses to see where any lingering negative attitudes might persist. As shown in Table 7, a statistically significant gender divide emerged in the 2026 findings. A majority of 59 percent of men continued to strongly or somewhat support a national deportation effort in 2026, whereas a majority of women (60%) either strongly or somewhat oppose such mass deportation efforts.
|
Gender* |
||
|
|
Male |
Female |
|
Strongly Support |
39% |
20% |
|
Somewhat Support |
20% |
15% |
|
Somewhat Oppose |
11% |
18% |
|
Strongly Oppose |
24% |
42% |
|
Not Sure |
6% |
5% |
* Statistically Significant at the 90 percent confidence level Chi-Square = 44.5, p = 0.00
Data Source: Stockton Poll of NJ voters, n=700, Feb. 2026
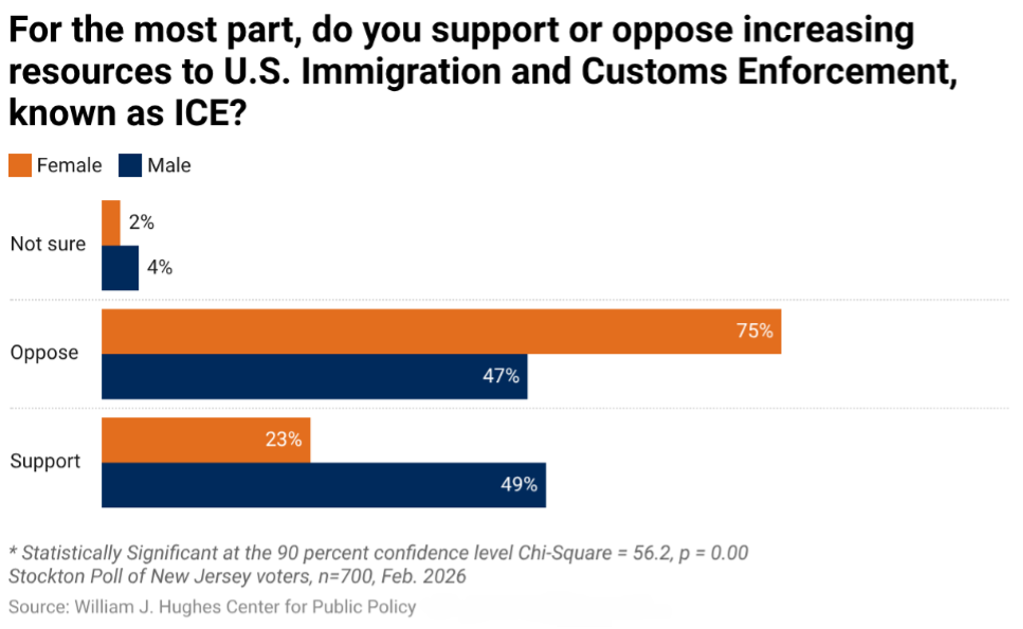
Similar gender divides appeared in some of the additional questions added to the 2026 poll. As shown in Table 8, a majority of 68 percent of women strongly disapproved of the Trump administration’s approach to immigration. Less than a majority of men (41 percent) felt the same way. In fact, if we combined the approve or somewhat approve and disapprove or somewhat disapprove response options into binary approve or disapprove options, we see that men are evenly split. Similarly in Graph 6, 64 percent of women strongly opposed providing ICE with more resources compared to 41 percent of men. More than twice the rate of men (35%) strongly supported increasing funding to ICE than women (15%). This difference is also statistically significant. Together, the findings suggest that gender became one of the more important demographic divides in immigration attitudes during the 2026 polling period.
|
Gender* |
||
|
|
Male |
Female |
|
Strongly Approve |
34% |
14% |
|
Somewhat Approve |
13% |
7% |
|
Somewhat Disapprove |
6% |
10% |
|
Strongly Disapprove |
41% |
68% |
|
Not Sure |
5% |
1% |
* Statistically Significant at the 90 percent confidence level Chi-Square = 71.3, p = 0.00
Data Source: Stockton Poll of NJ voters, n=700, Feb. 2026
Graph 4
Economic Insecurity Seems to be Driving Lingering Resistance to Immigration
Beyond the gender divide, the 2026 poll also revealed important differences across income and education categories. As shown in Table 9, there were statistically significant differences across education categories when it came to support for a national deportation effort. When we combine “strongly support” and “somewhat support” responses, we see that there is majority support (64%) for deportation efforts among those with a high school education or less. On the other hand, opposition to mass deportation efforts was strongest among those with higher levels of education.
|
Education* |
|||
|
|
High school or less |
Some college or associate’s degree |
A four-year college degree or more |
|
Strongly Support |
40% |
34% |
21% |
|
Somewhat Support |
24% |
19% |
15% |
|
Somewhat Oppose |
6% |
12% |
20% |
|
Strongly Oppose |
19% |
31% |
40% |
|
Not Sure |
11% |
4% |
5% |
* Statistically Significant at the 90 percent confidence level Chi-Square = 44.8, p = 0.00
Data Source: Stockton Poll of NJ voters, n=700, Feb. 2026
Similarly, opposition to increased resources for ICE was the highest among those with higher levels of education. A majority of those with either some college or an associate’s degree strongly oppose increasing ICE support, whereas we did not see such a majority response from those with no college education. These differences are statistically significant.
These education-related differences seem to suggest the lingering impact of economic insecurity. As the previous literature has suggested, misperceptions about immigration center around concerns that immigrants worsen employment and wage outlook for native-born workers. Such fears of job competition are likely to be felt more acutely by those in lower skilled work categories. So even as the overall positive attitudes toward immigration have resurged, those in lower educational groups seem to continue to harbor concerns about immigration.
Greater Contact with Immigrants Still Associated with Positive Views
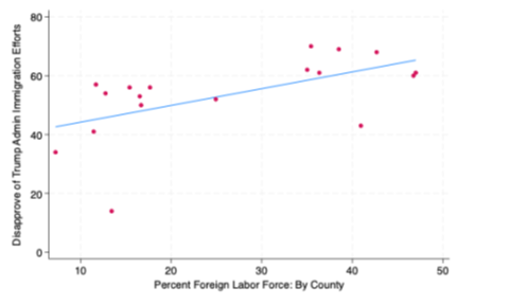
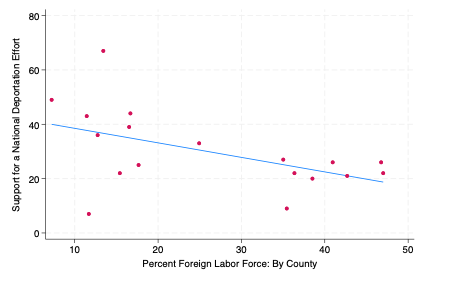
The relationship between immigrant density and immigration attitudes remained consistent in the 2026 poll. Counties with larger immigrant labor forces continued to show more favorable attitudes toward immigrants and lower levels of support for restrictive immigration policies. Graph 9 shows that disapproval of the Trump administration’s immigration approach tended to be higher in counties with higher concentrations of foreign-born workers. Similarly, Graph 10 shows that support for national deportation efforts declined as immigrant labor force density increased.
Graph 5
Graph 6
4. Conclusion
There has been considerable debate in the literature over whether anti-immigration sentiments are driven primarily by economic insecurities or by cultural and identity-related concerns. A few previous studies have emphasized the role of racial and cultural identity in shaping immigration attitudes.[15] Using two rounds of polling data collected during a period of substantial change in national attitudes toward immigration, this study helps illustrate how these dynamics may shift over time. In the 2024 poll, differences in attitudes toward immigration were most pronounced across racial and age categories, while differences across income categories were limited. By 2026, however, many of the racial differences observed in the earlier poll had narrowed considerably as overall attitudes toward immigration became more favorable. At the same time, differences across education categories became more apparent, particularly regarding support for deportation efforts and expanded immigration enforcement. These patterns may suggest that economic and job market concerns remain an important influence on immigration attitudes even as broader public sentiment shifts.
Despite accumulated evidence in the economic literature that immigration has mostly had a positive impact on the U.S. economy and on outcomes for native-born workers, the perception about immigrants as job competitors seems to linger. Rodrik (2022) has explored the links between economic insecurity and its influence on political sentiments across various dimensions.[16] He suggests that heightened anxiety about immigration among those in lower skilled occupations and lower income groups tends to be a reaction to economic insecurities they experience which may not be directly caused by immigration. This in turn makes them more inclined to cling to traditional identities and be fearful of cultural “outsiders,” fueling negative perceptions about immigration. The impact of economic anxieties therefore tends to have a more lingering impact even when periods of heightened hostility to immigrants subside. The persistence of more restrictive immigration attitudes among lower-education respondents in the 2026 poll is broadly consistent with this assertion.
Another significant finding is the large gender differences. One potential explanation might be that men perceive more of the job competition effects when it comes to immigrant labor. Women might be more likely to see the complementarity of immigrant labor since immigrant women tend to be concentrated in caregiving labor, which often supports native-born women’s ability to continue their own job market trajectories. However, we would need further research to determine what is driving this gender gap and whether it is merely transitory due to gendered reactions to recent ICE agent-involved shootings and the resulting media narratives or more deeply engrained.
Finally, the findings provide continued support for the contact hypothesis. It is particularly noteworthy that even at a time when racial divisiveness over immigration was heightened, there were more positive attitudes toward immigration from all racial groups in more immigrant-dense counties. These findings align with previous research suggesting that greater opportunities for repeated interactions with immigrants may reduce negative stereotypes and contribute to more favorable perceptions of immigration. Moreover, it may also be the case that in areas with higher concentrations of immigrants, the complementarity of immigrant labor and the positive impact that the economic literature has found is more noticeable and directly experienced by the native-born workers.
Overall, the findings demonstrate that public attitudes toward immigration among New Jersey voters are dynamic and shaped by a combination of economic, demographic, and social factors. The shifts observed between the 2024 and 2026 polling periods highlight how immigration attitudes can change alongside broader changes in political discourse, media coverage, and national policy debates.
Ramya Vijaya, Ph.D. is a Professor of Economics
at Stockton University and a Hughes Center
Faculty Research Fellow for 2025-2026.
Alicja Schleyer is an undergraduate Political Science student at Stockton University and Economics
Research Assistant.
Citations:
[1] Sergei Guriev and Elias Papaioannou, “The Political Economy of Populism,” Journal of Economic Literature 60, no. 3 (2022): 753–832; Dani Rodrik, “Why Does Globalization Fuel Populism?” Annual Review of Economics 13 (2021): 133–70; Sarah Schneider-Strawczynski and Jérôme Valette, “Media Coverage of Immigration and the Polarization of Attitudes,” American Economic Journal: Applied Economics 17, no. 1 (2025): 337–68.
[2] Guriev and Papaioannou, “Political Economy of Populism.”; Alberto Alesina, Armando Miano, and Stefanie Stantcheva, “Immigration and Redistribution,” The Review of Economic Studies 90, no. 1 (2022): 1–39.
[3] David Card, “Immigrant Inflows, Native Outflows, and the Local Market Impacts of Higher Immigration,” Journal of Labor Economics 19, no. 1 (2001): 22–64; David Card, “Is the New Immigration Really so Bad?” The Economic Journal 115, no. 507 (2005): F300–323; Gianmarco I. P. Ottaviano and Giovanni Peri, “Rethinking the Effect of Immigration on Wages,” Journal of the European Economic Association 10, no. 1 (2021): 152–97; Marco Tabellini, “Gifts of the Immigrants, Woes of the Natives: Lessons from the Age of Migration,” The Review of Economic Studies 87, no. 1 (2020): 454–86.
[4] Alex Nowrasteh, Sarah Eckhardt, and Michael Howard, “The Fiscal Impact of Immigration in the United States” (white paper, Cato Institute, Washington, DC, 2023); Francine D. Blau and Jennifer Hunt, “The Economic and Fiscal Consequences of Immigration: Highlights from the National Academies Report,” Business Economics 54, no. 3 (2019): 173–76.
[5] Rodrik, “Why Does Globalization Fuel Populism?”; Alesina, Miano, and Stantcheva, “Immigration and Redistribution.”.
[6] Tabellini, “Gifts of the Immigrants.”.
[7] Christian Dustmann and Ian Preston, “Racial and Economic Factors in Attitudes to Immigration,” IZA Discussion Paper no. 190, IZA Network, 2000.
[8] Alesina, Miano, and Stantcheva, “Immigration and Redistribution.”; Tabellini, “Gifts of the Immigrants.”
[9] Rodrik, “Why Does Globalization Fuel Populism?”
[10] Ramya Vijaya and Tatiana Shukovsky, “Immigration and the Labor Market,” Hughes Center Data Snapshots, May 2025, https://stockton.edu/hughes-center/latest-data-shows-immigrants-workers-contributions-to-the-nj-economy.html.
[11] Rodrik, “Why Does Globalization Fuel Populism?”
[12] Alesina, Miano, and Stantcheva, “Immigration and Redistribution.”; Tabellini, “Gifts of the Immigrants.”
[13] Myah Ward, “We Watched 20 Trump Rallies. His Racist, Anti-Immigrant Message Is Getting Darker,” Politico, October 12, 2024, https://www.politico.com/news/2024/10/12/trump-racist-rhetoric-immigrants-00183537.
[14] Southern Poverty Law Center, “Anti-Immigrant,” 2025, https://www.splcenter.org/resources/extremist-files/anti-immigrant/.
[15] Tabellini, “Gifts of the Immigrants.”; Dustmann and Preston, “Racial and Economic Factors.”
[16] Rodrik, “Why Does Globalization Fuel Populism?”