Methodology
The monitoring program performed by the Stockton University Coastal Research Center (CRC) monitors shoreline and beachface conditions twice a year, capturing erosional and depositional trends. Each successive year that the profiles are surveyed adds to a time series of information about long-term erosion and deposition on the New Jersey coast. This data aids NJDEP regulatory and planning personnel in the following ways:
- Determining areas of potential erosion problems.
- Implementing policies to protect beaches, dunes, overwash fans and erosion hazard areas (EHA), as well as reducing risks to development in these high hazard areas.
- Facilitating assessment of disaster impacts following future storm events.
- Providing useful background information, when evaluating NJDEP permit applications.
- Providing evidence on dune development at any site.
- Assisting local municipal governments in developing policies or plans for dealing with coastal erosion or improving storm preparedness.
Beach survey stations were chosen based on the following criteria:
- Each location represented typical community beach conditions.
- Each shoreline community would have at least one site.
- Where possible, sites utilized positions with prior survey data.
- Control profiles were sited on State or County undeveloped beaches.
Presently there are over 100 sites that must be profiled after the winter storm season
has ended in spring. The second annual survey occurs before the summer beach accretion
is removed by the increasing frequency of storms that occur in the fall and winter.
The CRC crew uses a Sokkia Set-530-R Electronic Total Station, which transfers the
data to an SDR-33 Electronic Field Book. The unit is initialized with position coordinates,
the elevation for two known locations, transit height, and target height. Environmental
factors such as temperature and atmospheric pressure, and unit columniation errors
are entered. Field personnel equipped with an optical prism mounted to a range pole
traverse the dunes, backbeach, shoreface, and continue into the water to a depth of
-15.0 feet NGVD. The prism pole height can be changed between data points as necessary.
The data is stored in the SDR-33 Electronic Field Book then downloaded at the office
into a personal computer. A beach profile typically consists of 35 to 55 individual
data points (Figure 2).
The survey information is edited, checked against field notes and sent to a database
for use and storage. The profile plots and computations have been performed using
ISRP27 a survey reduction program designed by the Coastal Engineering Research Center
(CERC) of the ACOE. A new program called BMAP (Beach Morphology Analysis Package,
v.2.0) is being used to format the survey data. Also designed by CERC, this program
is “windows” compatible and has more versatile data presentation capabilities. The
computation of the sand volume change between any two surveys can be set to run in
several ways. These unit volumes are given in cubic yards of sand per foot of beachfront
(yds3/ft). These unit volumes are typically valid for up to 1000 feet north or south
of any of the profile sites along the beachfront or to any groin/jetty structure.
Structures invalidate the calculation because of their sand collecting or starving
effect. All profiles were located as close to the center of any groin cell as possible
to limit this impact on sand quantity and beach configuration. Corel Draw v12 is used
to generate graphical images of the beach profile data. The Stockton University website
hosts the Coastal Research Center’s digital reports as both .pdf files or as a navigable
website for the 100-site file data since 1998. Annual reports are published for 1998,
2000, 2001, 2002, 2003, 2004 and 2005. In 2002 a special 15-year review of selected
profile locations was done to view all the information gathered since 1986. A .pdf
file is included that shows all the volume change and shoreline migration data for
all 100 sites between 1986 and 2002.
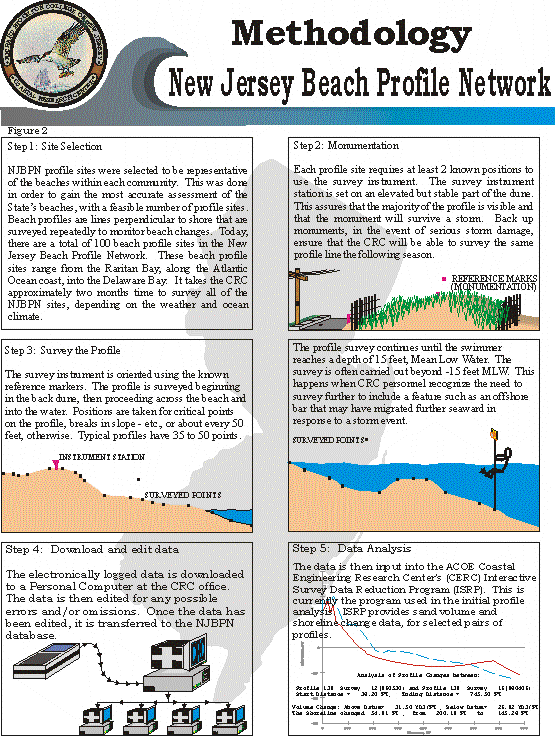
Steps illustrating how the data is collected and analyzed
Beach Nourishment Projects 2004-2005