Welcome
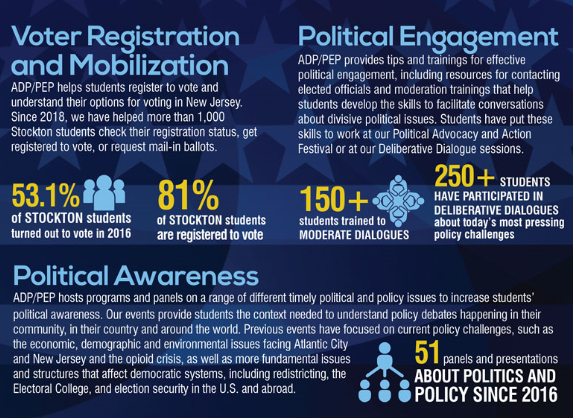
Since 2003, Stockton has been a part of the American Democracy Project (ADP), a nonpartisan initiative of the American Association of State Colleges and Universities (AASCU).
ADP is a network of nearly 300 state colleges and universities collaborating to deepen the impact public higher education institutions have on preparing students who:
-
Are empowered to be engaged and to lead in the future of our democracy
-
Directly contribute to a more competitive workforce and a stronger local and national economy
-
Have knowledge of the structures and processes of democracy and reflect on those processes
-
Learn to develop civic skills of critical thinking, deliberation, thoughtful listening and dialogue, particularly with opposing views and perspectives
-
Engage with their community
At Stockton, ADP is run by an interdisciplinary committee of faculty, staff, and students who collaborate to plan and promote programming that fosters civic education.

Election Day is November 4, 2025
Check out our Voter Registration and Options for Voting in New Jersey pages for up-to-date information about how you can participate in this fall's general election.
Comments? Questions? Would you like to work with the Hughes Public Policy Center to advance civic engagement efforts on campus?
Contact Claire Abernathy at claire.abernathy@stockton.edu


